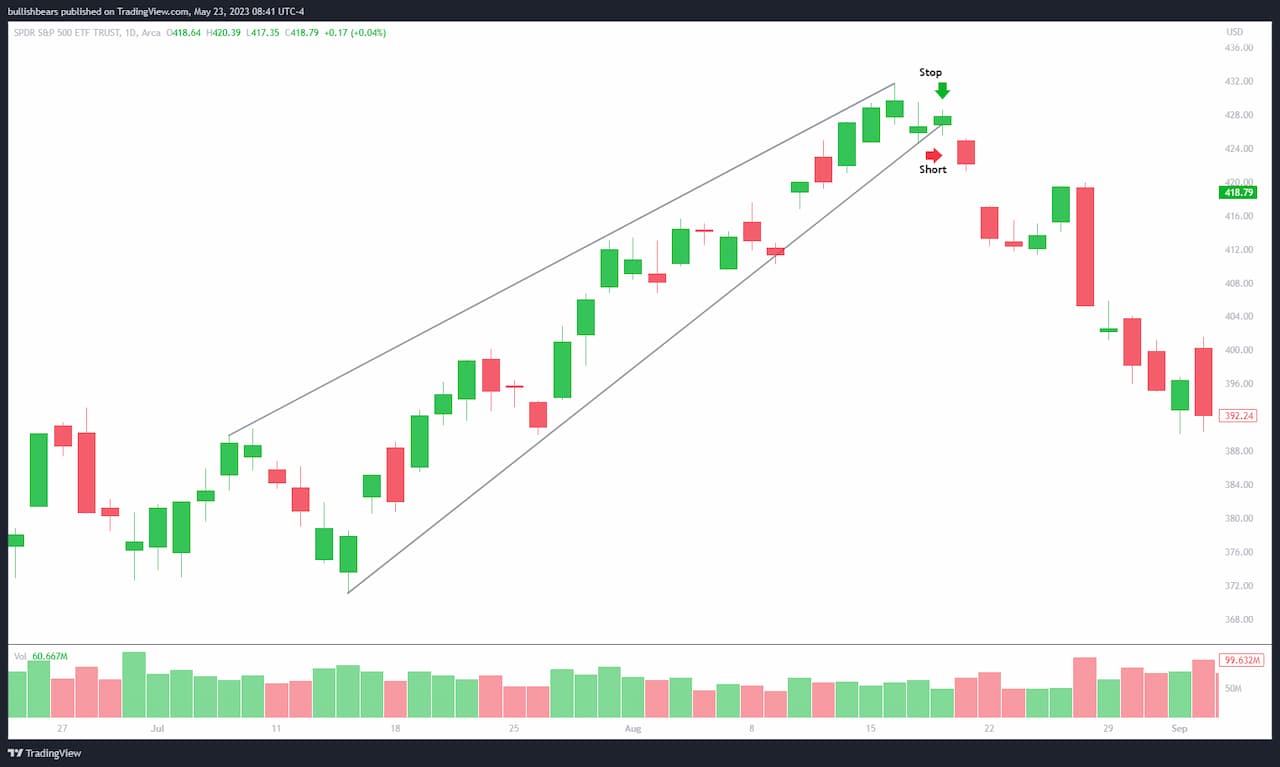
The Wedge Stock Pattern is a popular chart pattern. They form when two trend lines converge on a chart. This happens by drawing a stock’s highs and lows to achieve a wedge formation during the given period.
When the price moves, the lines seem to contract, which catches traders’ attention because this shape more often results in a price reversal or a breakout. Rising wedges and falling wedges are the two types of wedge stock patterns.

How to Identify a Wedge Stock Pattern
Identifying a wedge stock pattern can be tricky initially, but with time, it becomes easier. The following are the main things you need to identify when detecting a wedge:
- Converging Trendlines: See if you can find two lines on a price chart that tend to move in coinciding directions. These are the high and low prices of the stock.
- Decreasing Move: In a rising wedge, the price is increasing but not as fast as it should. The price is falling in a wedge, but not as fast as before.
- Breakout: Following the break of any of the trend lines, a reversal is highly likely. In the case of a rising wedge, it is time for a fall. In the case of a falling wedge, quash it.
Understanding the Rising Wedge Pattern
Rising wedge stock patterns happen when stock prices increase, even though the bullish trend is losing steam. In this pattern, the stock also records higher lows and higher highs, albeit at different angles. Sloped boundary lines encase these points; the upper line slopes down to give a wedge shape.
Here’s how it goes:
- The price is constantly moving upward. However, it is doing so at a slower pace.
- The most optimal entry occurs when the price is close to or below the dynamic lower trendline, where most breakouts typically happen. As a result, this indicates that the price will most likely move lower.
The falling wedge is a bullish pattern. Traders often buy the stock when they spot this pattern, expecting the price to rise soon after the breakout.
Pros and Cons
A falling wedge stock pattern is when a stock is falling, but the downtrend is losing momentum.
Pros
Wedge stock patterns are popular among traders because they offer several advantages:
- Clear Reversal Signals: The most common signals of price reversals are wedge patterns since they enable traders to forecast price swings before onset.
- Easy to Spot: Wedge patterns become relatively simple on the charts after some time.
- Risk Control: In wedge patterns, traders can set stop-loss levels near the entry price, reducing the risk of losing money from a trade that has gone wrong.
Cons
Wedge pattern downsides:
- False Breakouts: Sometimes, the price fails the wedge, only to reverse again.
- Ambiguity: Wedge patterns don’t always form perfectly, making them harder to identify and trade confidently.
- Limited Time Frame: Wedge patterns are short-term signals, making them less suitable for long-term investors.

How to Trade Wedge Patterns
Trading in wedge patterns can be great if you follow your trading and risk management plan. To start, you’ll need to wait for confirmation before you take any position.
Rather than taking the plunge at the sight of a pattern, wait for the price to break out of the trendline, which is a sign that a reversal is impending. Also, using the stop-loss is an effective way to control losses.
Where should I place my stop loss? The stop-loss should be placed just outside the opposite trendline to safeguard the trade if it fails. And check the volume.
When the price breaks the pattern but the volume is higher than the average, the breakout is strong and will most likely proceed in the direction of the new trend. These steps can help you make successful trades in wedge patterns.
What Other Patterns Should You Consider?
Wedge patterns aren’t the only ones to consider when deciding how to trade. Below are a few others you might want to put in your trading toolbox:
- Head and Shoulders Pattern: It signals a trend reversal and is one of the most well-known patterns in technical analysis. Use it to predict when a trend is about to change direction.
- Double Top and Double Bottom Patterns: These reversal patterns form after an asset hits the same price level twice. A double top signals that the price is likely to drop, while a double bottom signals that the price might rise.
- Triangle Patterns: Triangle patterns, like the ascending, descending, or symmetrical triangle, are used to forecast whether a trend will continue or reverse. They are quite similar to wedge patterns but interpreted differently.
- Flag and Pennant Patterns: These short-term continuation patterns signal that a sharp price movement will likely continue in the same direction.
Each pattern has pros and cons, but traders often compare them to wedge patterns when deciding their trading strategies.
Final Thoughts on Wedge Stock Pattern
The wedge stock pattern is one of the most useful patterns for traders who want to predict the occurrence of a price reversal. The same pattern in a rising wedge indicates a bearish trend, while the falling wedge pattern suggests a bullish reversal.
However, ensure that wedge patterns are used with other indicators to verify the breakout and minimize the chances of false breakout signals. Use proper risk management when trading a wedge stock pattern.
Frequently Asked Questions
Is a Rising Wedge Bullish or Bearish?
A rising wedge is a bearish pattern. It suggests that a stock’s price, which has been rising, might soon reverse and start to fall. Traders see this as a sign to sell or short the stock.
Is a Falling Wedge Bullish or Bearish?
A falling wedge is a bullish pattern. It suggests that a stock’s price, which has been falling, is likely to reverse and start to rise. Traders often buy the stock when they see a falling wedge pattern.
Can Wedge Patterns Be Used for Day Trading?
You can use wedge patterns for day trading as they help traders identify short-term price reversals. However, traders should use additional indicators, such as volume, to confirm the breakout before making trades.
What’s the Difference Between a Wedge Pattern and a Triangle Pattern?
Both patterns show converging trendlines, but they signal different things. Wedge patterns usually indicate a reversal in price, while triangle patterns often suggest a continuation of the current trend.
How Reliable Are Wedge Patterns?
Wedge patterns are fairly reliable, but they aren’t perfect like any technical analysis tool. They work best when combined with other indicators, such as volume, to confirm the price breakout.