
I know what you’re looking for.
The best Forex indicator that tells you when to buy & sell so your trading account can spit out money like an ATM (day after day).
Unfortunately, the single best Forex trading strategy and indicator don’t exist.
If it does, won’t we all be millionaires trading off a beach in Hawaii?
Now…
Even though there is no such thing as a best Forex indicator, there are indicators that work in different market conditions.
And if used correctly, it helps increase your winning rate and profit potential.
So here’s what you’ll learn today:
- How to use Moving Average indicator and increase your winning rate
- How to use Stochastic and “hunt” low risk and high reward trading setups
- How to use Average True Range and set a proper trading stop loss so you don’t get “stop hunted”
- How to use MACD indicator and pinpoint market reversals and breakouts accurately
- Which is the best Forex session indicator for short-term traders
- How to combine different Forex indicators and improve your trading results
Are you excited?
Then let’s begin!
The best Forex indicator: The magic of Moving Averages
The moving average is an indicator that “smooth out” past prices on your charts.
It’s easily one of the simplest and one of the best indicators for Forex.
But…
Don’t waste your time deciding whether you should use a simple, exponential, weighted, or linear moving average. Or whether you should use a short term or long term moving average.
It doesn’t matter — because there’s no such thing as the best moving average.
Instead, learn how moving average can fit your trading plan and help you make better trading decisions.
And here are 2 things it can help you with:
- How to use the moving average to trade with the trend
- How to use the moving average to ride massive trends
Let me explain…
How to use moving average and increase your winning rate
I’m sure you’ve heard this a gazillion time…
“The trend is your friend.”
But the question is, how do you define the trend?
Well, there are many ways to do it. But my personal approach is to use the moving average (MA) to define the long-term trend.
Here’s how to do it:
If the price is above the 200MA, then look to go long. And if the price is below the 200MA, then look to short.
An example:

Now you’re probably wondering:
“Is the 200MA the best?”
Here’s the thing… there’s no best moving average out there. I use the 200MA because it’s a summary of what the price has done over the last 200 candles.
But, if you want to define a shorter or medium-term trend, then adjust the parameter accordingly.
How to use the moving average to ride massive trends and improve your risk to reward
Here’s the thing:
If you want to ride big trends, you cannot have a profit target because it puts a limit on your profit potential.
So, what should you do?
You set a trailing stop loss.
This means as the market moves in your favor, you adjust your stop loss in the direction of the trend.
And one way to do this is to use the moving average indicator to set your trailing stop loss.
For example:
If you want to trail your stop loss using the 50MA, then you only exit your trade if the market closes beyond it.
Here’s what I mean…

Now…
If you want to ride a short-term trend, you can trail with a short-term moving average like the 20MA. Or, if you want to ride a long-term trend, you can trail with the 200MA.
The best Forex indicator: The simplicity of Stochastic
The Stochastic is a momentum indicator created by George Lane.
Here’s what he said…
“Stochastics measures the momentum of price. If you visualize a rocket going up in the air – before it can turn down, it must slow down. Momentum always changes direction before price.” — George Lane
In other words, the Stochastic indicator tracks the momentum of price. It identifies when the price is gaining or losing momentum.
But here’s the thing:
Most traders are using Stochastic indicator the wrong way. They go long when the price is oversold, and go short when the price is overbought.
If you ask me, this is one of the fastest ways to lose your money.
You’re probably wondering:
“So how should I use the Stochastic indicator?”
Well, here’s my secret…
How to use Stochastic and find low risk and high reward trading setups
- Trade in the direction of the long-term uptrend
- Wait for the price to reach oversold levels on Stochastic
- Wait for an entry trigger to get long
And vice versa for a downtrend.
An example…

The best Forex indicator: The awesomeness of the Average True Range
The Average True Range (ATR) is an indicator that measures the volatility of the market.
When the ATR has a low value, it means the market has low volatility and vice versa.
So the question is:
How do you use the ATR indicator in your trading?
Well, here are 2 techniques you can consider:
- How to use the ATR indicator to set a proper stop loss you don’t get stopped out unnecessarily
- How to use the ATR indicator to find high probability breakout trades
Let me explain…
How to use the ATR indicator to set a proper stop loss you don’t get stopped out unnecessarily
In my opinion:
One of the worst ways to place your stop loss is just below the lows of Support, or above the highs of Resistance.
Why?
It gets stop hunted easily because the market tends to trade beyond these levels by a few pips before reversing its direction.
An example:

So…
A solution is to use the ATR indicator and give you stop loss a buffer away from Support/Resistance.
Here’s how to do it if you have a short setup:
- Determine the ATR value
- Add the ATR above the highs of Resistance
Here’s an example:

Now, if you want to give your trade more “room to breathe” you can multiply the ATR value by 2, 3, or 4.
How to use the ATR indicator to find high probability breakout trades
Here’s a fact:
The market moves from low volatility to high volatility and back to low volatility.
Here’s what I mean:

So…
If you want to find high probability breakout trades, be alert when the market is in low volatility period — there’s a good chance it’ll break out.
Here’s how to do it:
- Wait for the ATR value to approach the lows
- Check if the market is in a range
- If the price breaks out of the range, you can expect momentum to continue
An example:

And if you want to trade the breakout, you can enter your trade when the price closes beyond the range.
You can start to see why this is one of the best indicators for Forex, right?
MACD Indicator Secrets
The Moving Average Convergence Divergence (MACD) indicator is a momentum and Trend Following indicator.
It has 3-parts to it: MACD line, Signal line, and MACD Histogram.
For this article, we’ll focus on the MACD histogram and here are 2 powerful techniques you can use…
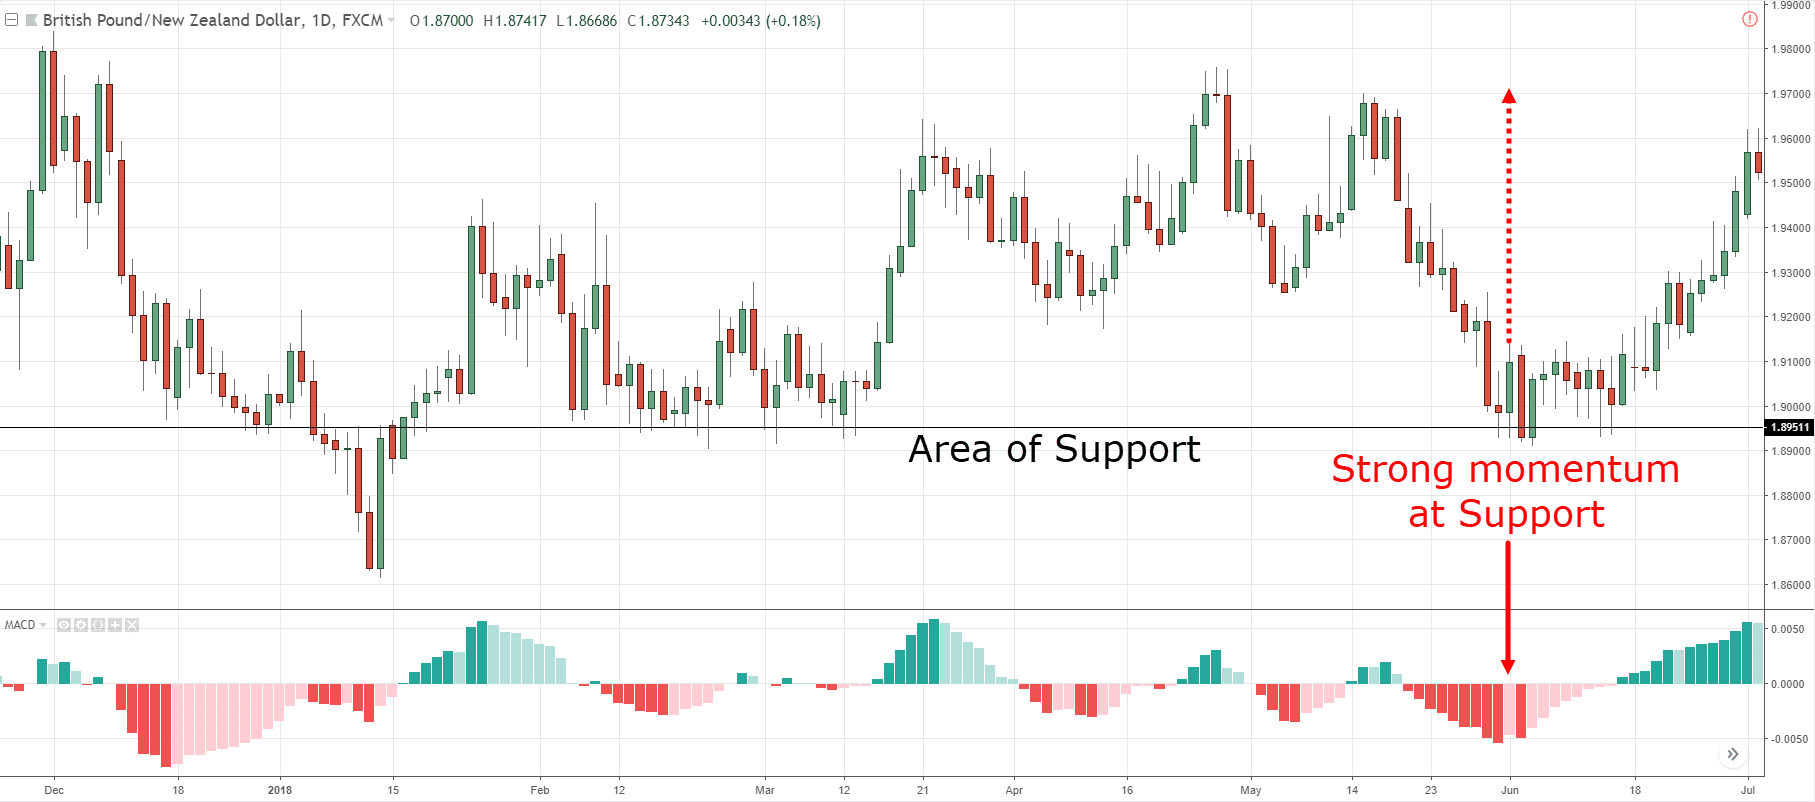
1. How to use MACD Histogram and identify momentum reversal
Here’s how it works…
- Wait for the price to come into Market Structure (like SR, Trendline, etc.)
- MACD Histogram shows a strong momentum (you want to see a high peak/trough)
- Wait for price rejection before trading in the opposite direction
Here’s an example:

Next…
2.MACD Histogram Squeeze: How to identify explosive breakouts about to occur
Here’s a fact:
Explosive breakouts usually occur when there’s low volatility in the market — you’ll notice the range of the candles gets small and “tight”.
But if you’re a new trader, this might not be easy to spot.
So, that’s when the MACD Histogram can help you.
Here’s how…
The price comes into key Market Structure (like SR, Trendline, etc.)
The MACD Histogram looks almost “flat” without any visible peak/trough
Enter the breakout when the price breaks the Market Structure
Here are a few examples:


This is powerful stuff, right?
The best Forex session indicator
If you trade forex, then you know there are 3 main sessions to it — Asian, European, and New York.
To make things worse, you have daylight savings which shift back the European and New York Session by an hour (during a certain period of the year).
And if you’re a short-term trader, you don’t want to miss the period when the European and New York sessions overlap one another as the market tends to be the most volatile.
Now you’re probably wondering:
“How do I keep track of the different time zones and trading sessions?”
Well, I’ve got good news for you because there’s an indicator called “Forex Sessions” by Chris Moody (available for free on TradingView).
Here’s how to add the indicator to your charts:
- Select the indicator tab
- Search the indicator called “Forex Session” by Chris Moody
- Add the indicator to your charts
Here are the settings I used:

Then you should see something like this:

Here’s what it means…
Beige background – The Asian session
Blue background – The European session
White background – The New York session
Beige solid line – Opening hour of the Asian session
Blue solid line – Opening hour of the European session
Dark blue solid line – Opening hour of New York session
Now if you want to learn how to use this indicator, then go watch this training video below…
Now you’re probably wondering:
“What use is the Forex Session indicator?”
That’s a good question.
And here are 2 ways it can help your trading:
- You understand your currency pair intimately and can identify “hidden” opportunities
- You can backtest intraday trading strategies with ease
Let me explain…
You understand your currency pair intimately and can identify “hidden” opportunities
Here’s a fact:
If you spend a lot of time watching a market, you’ll start understanding the intricacies of it.
For example:
- How it reacts before a news release
- How it reacts after a news release
- How it behaves during the Asian session
- How it behaves during the European session
- How it behaves during the New York session
- What is the average daily range
- And etc.
This is a goldmine because you can identify “hidden” opportunities that aren’t privy to other traders.
And with the Forex Session indicator, it makes things easier for you because it highlights the respective trading session on the charts.
Here’s a simplified example…

As you can see…
Over the last 5 trading sessions, USD/CAD is the most volatile during the European session.
So if you’re a day trader, then you want to find trading opportunities near the start of European session to take advantage of the “big move”.
Also…
You’ll realize that different markets “behave” differently and it’s your job to know your markets intimately.
You can backtest discretionary intraday trading strategies with ease
The Forex Session indicator makes it easy for traders to manually backtest intraday trading strategies.
Here’s what I mean:
Previously, if you want to backtest a “London Breakout” strategy, you must scroll your charts to the London open and manually record your results.
If you’ve done it before, you know it’s time-consuming to find the exact location on the chart where London opens.
You’ve got to manually move your mouse to each candle and check if you’ve got the correct candle for London open.
Sucks right?
But the good news is…
You can just switch on the Forex Session indicator and find the blue vertical line on your chart because that’s the candle of London open.
Imagine how much time you’ll save without ever “hunting” for the London open candle ever again.
Now, let’s move on…
How to combine different Forex indicators the correct way
The purpose of trading indicators is to summarize the historical chart data so you can better interpret the “behavior” of the markets.
And if you want to take things a step further, you can combine different Forex indicators and get better trading results.
But if your charts look like this:

You’re obviously doing it wrong.
So…
Here are 2 rules to follow when combining different forex indicators…
- Every trading indicator on your charts must have a purpose
- You only need one indicator for each purpose
Let me explain…
1. Every trading indicator on your charts must have a purpose
You’re probably wondering:
“What do you mean by purpose?”
Well, it means what the trading indicator is used for.
For example:
- Is it used to define a trend?
- Identify the market’s volatility?
- Define an area of value?
- Act as an entry trigger?
- Set a stop loss?
2. You only need one indicator for each purpose
Let’s say you want to define the trend using a moving average indicator — that’s fine.
But, you shouldn’t throw in ADX, Bollinger Bands, channels, and etc. to define the trend.
Because you’ve got your moving average and that’s all you need, period.
So, remove all the unnecessary indicators on your chart and leave those that serve a purpose.
Does it make sense?
Great!
Frequently asked questions
#1: Is the 200MA less important when focusing on shorter-term trends?
The 200MA is useful to understand the longer-term trend. So if you’re only focusing on the shorter-term trends, then the 200MA would be less important.
#2: I was trading the 5-minute, 15-minute and 1-hour timeframes but my stops were hitting frequently at 1ATR before moving in my favour. Does price action work on lower timeframes too? Or should I only trade in higher timeframes like 4-hour or the daily?
If your stops keep getting hit often, then you might consider widening your stops with 2ATR or 3ATR.
Yes, price action can work on the lower timeframe if there’s sufficient liquidity in the markets.
But I can’t really say if you should or shouldn’t trade the 4-hour and the daily timeframes, because it depends on your goals from trading, whether you want to be a day trader or position trader, etc.
Conclusion
Here’s the deal:
There is no such thing as the best Forex trading strategy and indicator — it’s a fantasy.
However, certain indicators work best in different market conditions.
For example, you’ve learned:
- How to use the Moving Average indicator to improve your winning rate
- How to use the Stochastic indicator to find high probability trading setups
- How to use the Average True Range indicator to set a proper stop so you don’t get stopped out unnecessarily
- Which is the best Forex session indicator for short-term traders
- How to combine different Forex trading indicators and improve your trading results
Now I’m curious…
Which is the best forex indicator that helps your trading?
Leave a comment below and let me know your thoughts.
Now you’re probably wondering:
“What use is the Forex Session indicator?”
That’s a good question.
And here are 2 ways it can help your trading:
- You understand your currency pair intimately and can identify “hidden” opportunities
- You can backtest intraday trading strategies with ease
Let me explain…
You understand your currency pair intimately and can identify “hidden” opportunities
Here’s a fact:
If you spend a lot of time watching a market, you’ll start understanding the intricacies of it.
For example:
- How it reacts before a news release
- How it reacts after a news release
- How it behaves during the Asian session
- How it behaves during the European session
- How it behaves during the New York session
- What is the average daily range
- And etc.
This is a goldmine because you can identify “hidden” opportunities that aren’t privy to other traders.
And with the Forex Session indicator, it makes things easier for you because it highlights the respective trading session on the charts.
Here’s a simplified example…
As you can see…
Over the last 5 trading sessions, USD/CAD is the most volatile during the European session.
So if you’re a day trader, then you want to find trading opportunities near the start of European session to take advantage of the “big move”.
Also…
You’ll realize that different markets “behave” differently and it’s your job to know your markets intimately.
You can backtest discretionary intraday trading strategies with ease
The Forex Session indicator makes it easy for traders to manually backtest intraday trading strategies.
Here’s what I mean:
Previously, if you want to backtest a “London Breakout” strategy, you must scroll your charts to the London open and manually record your results.
If you’ve done it before, you know it’s time-consuming to find the exact location on the chart where London opens.
You’ve got to manually move your mouse to each candle and check if you’ve got the correct candle for London open.
Sucks right?
But the good news is…
You can just switch on the Forex Session indicator and find the blue vertical line on your chart because that’s the candle of London open.
Imagine how much time you’ll save without ever “hunting” for the London open candle ever again.
Now, let’s move on…
How to combine different Forex indicators the correct way
The purpose of trading indicators is to summarize the historical chart data so you can better interpret the “behavior” of the markets.
And if you want to take things a step further, you can combine different Forex indicators and get better trading results.
But if your charts look like this:
You’re obviously doing it wrong.
So…
Here are 2 rules to follow when combining different forex indicators…
- Every trading indicator on your charts must have a purpose
- You only need one indicator for each purpose
Let me explain…
1. Every trading indicator on your charts must have a purpose
You’re probably wondering:
“What do you mean by purpose?”
Well, it means what the trading indicator is used for.
For example:
- Is it used to define a trend?
- Identify the market’s volatility?
- Define an area of value?
- Act as an entry trigger?
- Set a stop loss?
2. You only need one indicator for each purpose
Let’s say you want to define the trend using a moving average indicator — that’s fine.
But, you shouldn’t throw in ADX, Bollinger Bands, channels, and etc. to define the trend.
Because you’ve got your moving average and that’s all you need, period.
So, remove all the unnecessary indicators on your chart and leave those that serve a purpose.
Does it make sense?
Great!
Frequently asked questions
#1: Is the 200MA less important when focusing on shorter-term trends?
The 200MA is useful to understand the longer-term trend. So if you’re only focusing on the shorter-term trends, then the 200MA would be less important.
#2: I was trading the 5-minute, 15-minute and 1-hour timeframes but my stops were hitting frequently at 1ATR before moving in my favour. Does price action work on lower timeframes too? Or should I only trade in higher timeframes like 4-hour or the daily?
If your stops keep getting hit often, then you might consider widening your stops with 2ATR or 3ATR.
Yes, price action can work on the lower timeframe if there’s sufficient liquidity in the markets.
But I can’t really say if you should or shouldn’t trade the 4-hour and the daily timeframes, because it depends on your goals from trading, whether you want to be a day trader or position trader, etc.
Conclusion
Here’s the deal:
There is no such thing as the best Forex indicator — it’s a fantasy.
However, certain indicators work best in different market conditions.
For example, you’ve learned:
- How to use the Moving Average indicator to improve your winning rate
- How to use the Stochastic indicator to find high probability trading setups
- How to use the Average True Range indicator to set a proper stop so you don’t get stopped out unnecessarily
- Which is the best Forex session indicator for short-term traders
- How to combine different Forex trading indicators and improve your trading results
Now I’m curious…
Which is the best forex indicator that helps your trading?
Leave a comment below and let me know your thoughts.