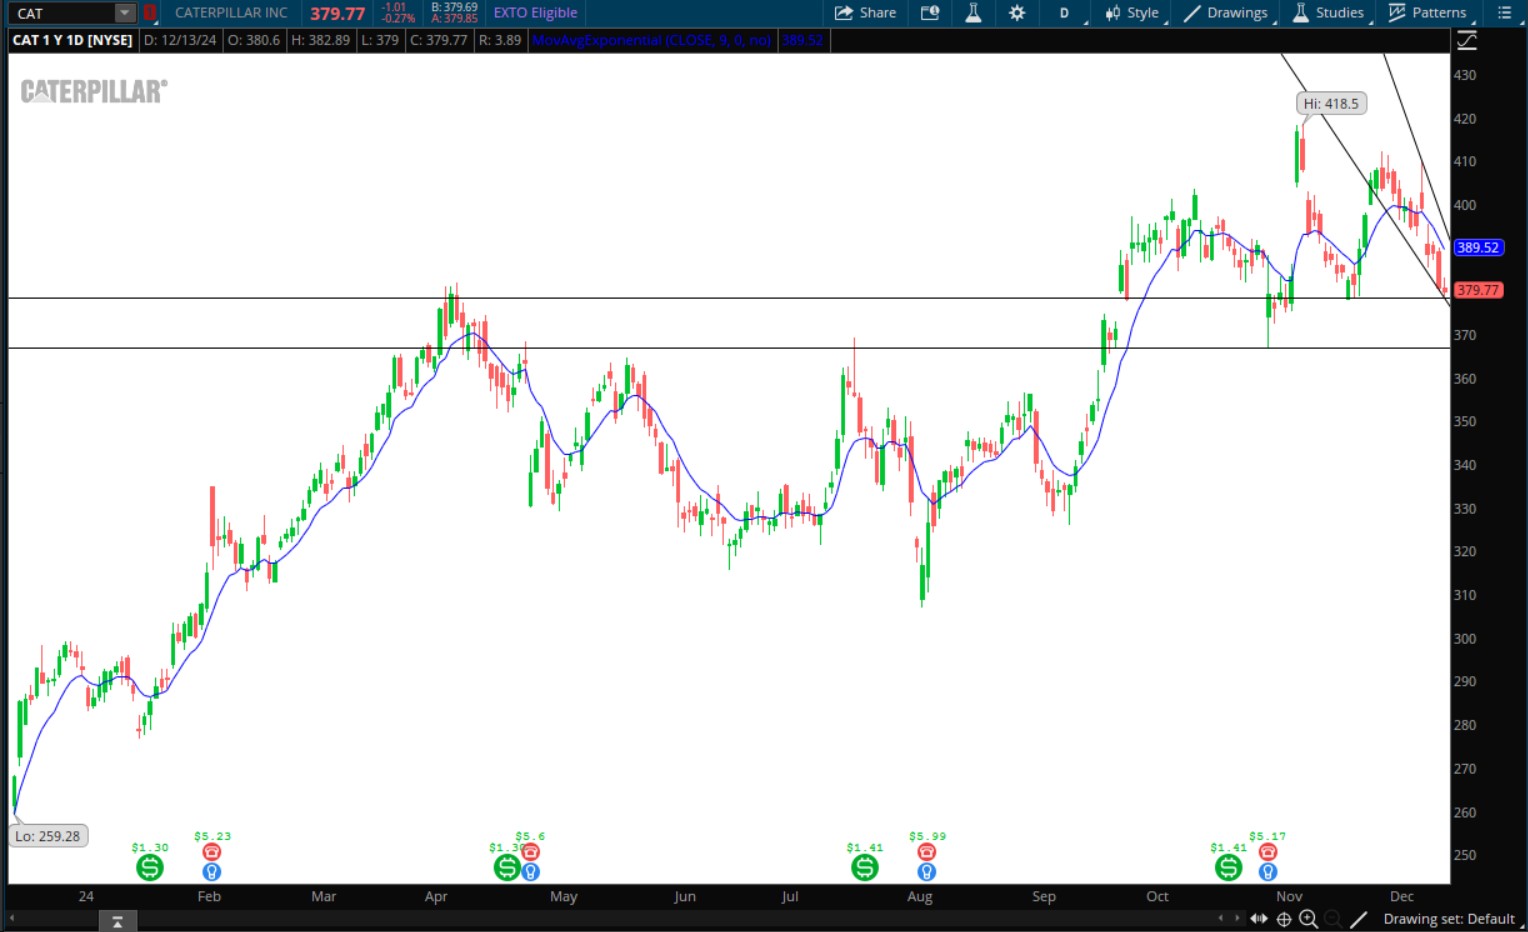
Have you heard of the Island Reversal Pattern? You need to be able to identify key price patterns to make informed decisions in stock market trading.
One pattern to look for is the Island Reversal Pattern. This formation can signal a potential trend reversal and present opportunities for day trading and swing trading strategies.
Knowing how to recognize and trade this pattern can give traders an edge in capturing market movements. Today, our blog will discuss the Island Reversal Pattern, explain how it works, and show you how to use it in different trading scenarios. Read on to learn more.

What Is the Island Reversal Pattern?
The Island Reversal Pattern indicates the potential reversal to an existing trend. How does it form? A group of consecutive price bars or candlesticks (usually two or more days) are separated by gaps on both sides. The gaps create a visual “island” on the chart, hence the name.
Typically, this pattern forms at the end of a strong trend—either bullish (uptrend) or bearish (downtrend)—and signals that a price reversal is likely.
How can you find the Island Reversal? Look for it on bar charts, not just candlestick charts. Did you know technical traders often use it to predict future price movement and whether it’ll be up or down?

How Does the Island Reversal Pattern Form?
You need to Understand the formation of the Island Reversal so you can recognize it on charts. The pattern forms in two stages:
Price Gaps on Both Sides
An island reversal pattern starts with a price gap on one side, followed by a cluster of days or candlesticks. Then, another gap appears on the other side. As a result, this creates a “gap island” that can be isolated from the surrounding price action. The key feature is that these gaps often don’t get filled immediately, setting the stage for a reversal.
The Price Reversal
After these gaps form, the price generally reverses direction. The direction of the reversal (up or down) will depend on whether the pattern forms at the top of an uptrend (bearish reversal) or the bottom of a downtrend (bullish reversal).
Key Takeaways
- The Island Reversal Pattern occurs when a cluster of trading days is separated by gaps on both sides, signaling a potential trend reversal.
- It can indicate both bullish (upward) and bearish (downward) reversals, with tops (bearish reversals) being more common.
- Recognizing the pattern involves spotting price gaps after a prolonged trend, which often signals a shift in momentum.
- The Island Reversal is more reliable when accompanied by high trading volume.
- Use for day and swing trading to anticipate or act on market reversals.
How to Recognize the Island Reversal
Here’s how to spot the Island Reversal Pattern so you can see if a price reversal is coming.
Step 1: A Strong Trend
It usually forms after a strong price movement, up or down. The Island Reversal follows a strong trend and doesn’t appear out of nowhere.
Step 2: Identify the Gaps
The core of the island reversal pattern is the formation of two price gaps. The first gap happens after a big move (up or down). How do you get confirmation? The second gap confirms the reversal.
Step 3: Confirm with Volume
Like many other technical patterns, the Island Reversal is more reliable when accompanied by high trading volume. A large gap with low volume might indicate a false signal, while a high-volume gap suggests more conviction in the potential reversal.
Types of Island Reversal Patterns
Island Reversal Patterns come in two main forms: one indicating a potential upward trend reversal (bullish) and the other signaling a potential downward trend reversal (bearish).
Bearish Island Reversal (Top Formation)
This is the most common form of the pattern. It occurs after a prolonged bullish trend when the price suddenly gaps upward. After a few days, it gaps down, leaving a small “island” of trading days in the middle. This is an indication that price has likely peaked. So it’s due for a reversal, signaling a bearish trend on the way.
Bullish Island Reversal (Bottom Formation)
Though less common, the bullish island reversal is equally powerful. It forms after a long-term bearish trend when the price gaps downward and creates a small island. After a few days of downward movement, the price gaps upward, signaling that the downtrend is reversing and a bullish trend is likely to follow.
How to Trade the Island Reversal Pattern
If you spot the Island Reversal Pattern, you can capitalize on the price shift by putting it into your trade plan.
For Day Trading
- Short-Term Reversals: The Island Reversal Pattern is used to find short-term trend reversals for the same trading day. If you see a bullish reversal pattern, you could go long. You’re betting on price rising in the short term. On the other hand, when a bearish island reversal occurs, traders might consider shorting the stock, expecting its price to decline.
- Quick Entry and Exit: Because day trading focuses on short-term profits, traders should enter and exit positions quickly after the Island Reversal is confirmed. As prices change rapidly, these trades typically last only a few hours.
For Swing Trading
- Long-Term Reversals: Swing traders focus on capturing price movements over several days or weeks. The Island Reversal Pattern can be a great signal for identifying the start of a new swing in the opposite direction of the previous trend. Swing traders typically wait for reversal confirmation with volume and trend analysis before entering a trade.
- Risk Management: Using proper risk management is essential in swing trading. Traders often place stop-loss orders just below the low of the bullish island reversal or above the high of the bearish island reversal, protecting their capital if the reversal doesn’t appear as expected.
Real-Life Example of Island Reversal
Let’s peek at a potential Island Reversal pattern on the BTCUSDT 1D chart below.
- An Island Reversal can be easily recognized after a trendline for BTCUSDT that spans about one year.
- This pattern shows up when two distinct gaps separate a cluster of trading days or weeks.
- The heightened volume during the island reinforces the validity of the pattern.
- It can signify a significant shift in market trends, potentially leading BTCUSDT into a bearish market. As you can see in the chart, this is in line with Fibonacci retracements.
However, it’s important to remember that the Island Reversal is based on the premise that the two gaps are unlikely to be filled quickly, and part of them has already been filled. So, it’s smart to wait a week or two to assess the price direction.
However, you need to be aware of the debate surrounding the island reversal and its effectiveness. There are some argue that this pattern appears infrequently and tends to perform poorly.

Island Reversal Pattern Pros
The Island Reversal Pattern can be a powerful tool in a trader’s toolbox. Here are a couple advantages to trading based on this formation:
- Clear Reversal Signals: The Island Reversal Pattern specifies a trend reversal. This makes it easier to act confidently in day and swing trading.
- Versatility Across Timeframes: The pattern works on various timeframes. Swing traders can use it with one-minute or long-term charts.
Island Reversal Pattern Cons
- False Signals: The Island Reversal can sometimes produce false signals, particularly in volatile or low-volume markets.
- Requires Confirmation: You must confirm the Island Reversal with other indicators like volume.
Final Thought on Island Reversal Pattern
Mastering the Island Reversal Pattern can give traders a powerful tool to identify potential trend changes in the stock market. By understanding how the pattern forms and how to apply it in day trading and swing trading strategies, you’re able to make more informed decisions and increase your chances of success.
It’s important to confirm patterns with other indicators. You should also use good risk management to minimize false signals. While the Island Reversal pattern can provide helpful insights, no pattern is guaranteed to work every time.
Frequently Asked Questions
What Causes an Island Reversal Pattern?
The pattern usually emerges when market sentiment shifts, often driven by breaking news, earnings results, or broader economic shifts. These catalysts cause price gaps, which lead to a reversal when combined with the prior trend.
Can the Island Reversal Pattern Be Used in Forex Trading?
While the Island Reversal is typically seen in the stock market, it can also be applied to Forex trading. The concept remains the same: price gaps followed by a reversal indicate a potential change in trend.
Is the Island Reversal Pattern Reliable?
It can be reliable with other technical indicators, such as volume analysis or momentum. However, like all patterns, it is not foolproof and should be part of a broader strategy.